Global Language Bridge ©
Linguistic Systems Architecture™ for Technical Operations
NDA n° 76 31 15042 31
SIRET n° 89396954300022

Linguistic Systems Architecture™
(LSA)
"The value of education is not the learning of many facts; It's the training of the mind to think."
Albert Einstein
Key concepts, differentiators, and strategic logic of Linguistic Systems Architecture™
Pillar I
Cognitive Load Optimization
We identify the "friction points" where technical logic and language translation collide. By implementing Executive Macros (pre-built linguistic code), we free up your brain to focus on the technical problem, not the grammar.
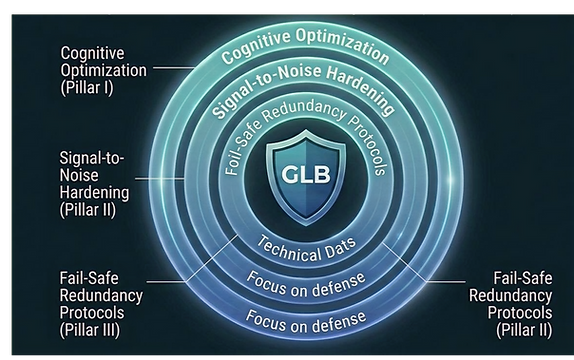
Pillar II
Signal-to-Noise Hardening
Using our proprietary SNR Analysis, we audit your communication to strip away "linguistic noise" (fillers, hesitations, and cultural ambiguity). We ensure your "Signal" is 100% clear, even on low-quality audio calls or in high-stress boardrooms.
Pillar III
Fail-Safe Redundancy Protocol
We apply aerospace engineering principles to speech. You will learn to build Linguistic Backups into your communication, ensuring critical data is received and confirmed through three independent structural loops.
Details Explained
Visual 1 - The LSA Operational Assembly Line
This is a hyper-detailed infographic showing the "manufacturing flow" of thought. A conveyor belt transports a "Raw Product" (German Technical Thought) into a three-step processing machine: (1) Cognitive Optimization, (2) Signal-to-Noise Filtering, and (3) Redundancy Loop Confirmation. A finished, polished product ("100% Signal English") emerges on the other side. This is your primary methodology visual.
Visual 2 - The "Noise-Filter" Waveform Spectrum
This is a spectral analysis chart. On the left, it shows an erratic, messy waveform labeled "Raw Communication (High Noise, low signal)." A central cylinder acts as the "Proprietary SNR Filter." On the right, the spectrum is now a sharp, clean, high-amplitude blue line, labeled "LSA Signal Output (Guaranteed Clarity)."
Visual 3 - The 3D exploded "Technical Blueprint"
This looks like an engineering drawing from Porsche R&D. A complex industrial component is shown with three separate exploded-view callouts. Component 1: "Brain Focus Gearbox (Cognitive Optimization)." Component 2: "Signal-Filter Manifold (SNR Hardening)." Component 3: "Reinforced Chassis (Fail-Safe Redundancy)." This directly links communication architecture to mechanical engineering.

Visual 4 - The Competitive "Value Density" Bar Chart
This is a standard stacked bar chart. Bar 1 is "Standard Academy (e.g., LTC)," and Bar 2 is "GLB (Linguistic Systems Architecture)." The chart shows GLB with twice the total value density, broken down by cost-recovery (Pillar I/II/III), while LTC's value is mostly "Agency Overhead" and "+19% VAT."
Visual 5: The "Executive Velocity" Project Timeline
This gantt-chart view maps a typical 4-week "Hardening Sprint." Week 1 is "Pillar I (Cognitive Onboarding)." Week 2 is "Pillar II (Signal Filtering)." Weeks 3-4 are "Pillar III (Fail-Safe Redundancy)." It contrasts this 4-week process against a 6-month timeline for traditional training to achieve the same result.
Visual 6: The "Retention & ROI" Scatter Plot
This chart has "Retention after 3 Months (%)" on the Y-axis and "Return on Investment (€ Saved)" on the X-axis. A red standard line shows standard training with low retention/ROI. A sharp upward blue curve, labeled "LSA Protocol," shows exponential ROI as linguistic skills are retained and utilized, directly impacting technical uptime.

The psychology of language —
formally known as psycholinguistics — is an incredibly massive and influential field. Far from being a niche or fringe theory, it is a foundational pillar of modern cognitive science, neuroscience, and artificial intelligence.
It is completely and universally accepted by mainstream experts, though like any major scientific discipline, it contains vigorous internal debates. Here is a breakdown of its scale, its status among experts, and how it impacts your language-learning journey.
Summary
● Massive Scale: It is an expansive, multi-disciplinary field taught at nearly every major university worldwide, directly driving the engineering behind modern AI voice systems and translation tools.
● Total Expert Acceptance: The field itself is standard science. The internal debates aren't about if the psychology of language matters, but how the brain's internal mechanics actually process it.

Psycholinguistics is vast because it sits at the exact intersection of several major sciences. It acts as the bridge connecting separate fields of research. Contributors: Psycholinguistics Cognitive Psychology Neuroscience What They Bring to psycholinguistics: Studies the software (how memory, attention, and focus affect your speech). Studies the hardware (using fMRI and EEG brain scans to physically see language happen). Computer Science / AI Provides the formal structural rules of language (phonetics, grammar, syntax). Uses human psycholinguistic models to train Large Language Models (LLMs) and speech-recognition software.